Chart of Monthly Coal-Fired Net Generation (MWh) of Unit 1 (PC1), Unit 2 (PC2), and Combined Total

The above chart shows the monthly Prairie State generation for both of the two coal-fired generating units and the combined total. It also illustrates that there are months when one of the two generating units produce zero or nearly zero electricity due to planned maintenance and unplanned outages.
Our spreadsheet file for the above chart is PSEC_NetGeneration.xlsx and the source data comes from EIA-923 net generation data downloaded from the U.S. Energy Information Administration website at:
https://www.eia.gov/electricity/data/eia923/
We also track of the number of days per year where there is no generation. These days with zero generation include both planned and unplanned outages:
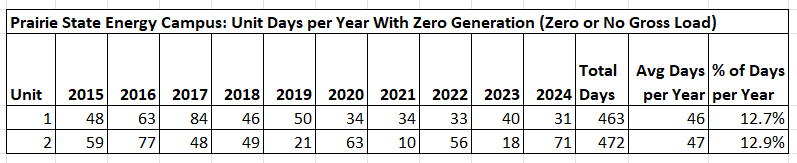
For the years 2015 thru 2024:
– Unit 1 had a total of 463 days where it did not generate any electricity, an average of 46 days per year. The largest number of days per year was 84 in 2017.
– Unit 2 had a total of 472 days where it did not generate any electricity, an average of 47 days per year. The largest number of days per year was 77 in 2016, although 2024 was a close second with 71 days.
– In December 2024, there were 12 days where neither Prairie State Unit 1 nor 2 were generating any electricity. And for 7 of those days (Dec 3-9), Trimble County Unit 2 was not generating any electricity either.
See the worksheets in our spreadsheet PSEC_UnitDays_ZeroGeneration.xlsx for the Prairie State details. Our source is daily U.S EPA Clean Air Markets data downloaded from the U.S. EPA website at:
https://campd.epa.gov/data/custom-data-download