Chart of Monthly Coal-Fired Generation (MWh) of Unit 1 (TC1), Unit 2 (TC2), and Combined Total

The above chart shows the monthly Trimble County generation for both of the two coal-fired generating units and the combined total.
Our spreadsheet file for the above chart is Trimble_NetGeneration.xlsx and the source data comes from EIA-923 net generation data downloaded from the U.S. Energy Information Administration website at:
https://www.eia.gov/electricity/data/eia923/
We also track of the number of days per year where there is no generation. These days with zero generation include both planned and unplanned outages:
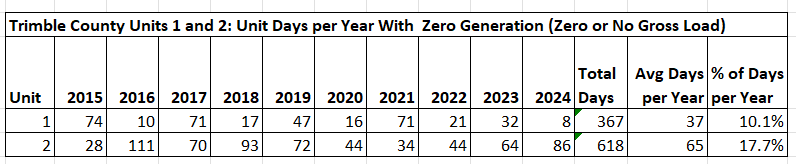
For the years 2015 thru 2024:
– Unit 1 had a total of 367 days where it did not generate any electricity, an average of 37 days per year. The largest number of days per year was 74 in 2015,
– Unit 2 had a total of 618 days where it did not generate any electricity, an average of 65 days per year. The largest number of days per year was 111 in 2016. Last year 2024 it was 86 days, equivalent to almost 3 months.
See the worksheets in our spreadsheet Trimble_UnitDays_ZeroGeneration.xlsx for the details. Our source is daily U.S EPA Clean Air Markets data downloaded from the U.S. EPA website at:
https://campd.epa.gov/data/custom-data-download