Average price comparisons using annual data from the US Energy Information Administration (EIA) support Naperville’s report that Naperville residential customers pay less for electricity than ComEd customers. However, the comparison results are not the same using data for commercial and industrial customers. And the difference is greater when including the example of an alternative that is not available to Naperville customers, an Alternative Retail Electric Supplier (ARES)[i]
Naperville’s Comparisons
Naperville reports that Naperville electric rates are lower than ComEd. Naperville’s comparison calculations use an average residential customer’s consumption to calculate electric bills using Naperville rates and ComEd bundled service rates, and Naperville’s comparisons also include two specific commercial examples.[ii]
Our Comparisons Using EIA-861
Our comparisons of Naperville with ComEd are based on sales data reported in the U.S. Energy Information Administration (EIA) Form EIA-861, Annual Electric Power Industry Report[iii]. Since over 60% of the total kilowatt-hours delivered to ComEd customers is purchased through ARES suppliers[iv], in addition to comparing with ComEd bundled we include ComEd delivery with an ARES example. And we chose the largest ARES provider, Constellation NewEnergy.
We compare using an average price per kilowatt-hour (kWh) metric from EIA-861 utility sales data.
- We calculate the average price per kWh by dividing total sales revenue (in thousand dollars) by megawatt-hours sold.
- We use data for residential, commercia, and industrial sector categories.
- Our comparison includes Naperville, ComEd Bundled, and ComEd Delivery + Constellation NewEnergy.
- We choose the years 2012 through 2023, beginning with the starting year of Naperville’s power supply from IMEA. EIA-816 data for 2024 is scheduled to be posted in Oct 2025.
Result Graphs
The graphs of our comparisons are listed below. Our corresponding worksheets and detail data from EIA-861 are available in our spreadsheet file: Naperville_ComEd_EIA-861_Sales_Ult_Cust.xlsx
https://docs.google.com/spreadsheets/d/1cVBjtX-wtVXPyYnJoXSOzss6B1f5QRAA/view
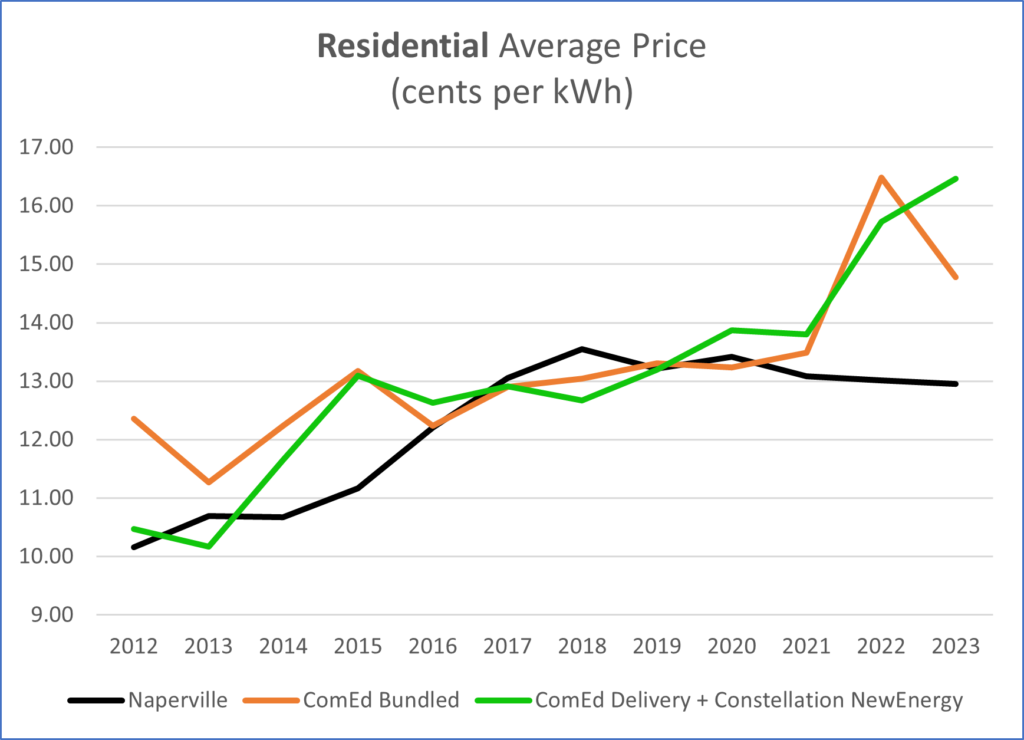
Residential Average Price

The Residential Average Price graph shows that, in general, Naperville average price is lower each year than both ComEd Bundled and ComEd Delivery + Constellation NewEnergy. 2017 and 2018 are exceptions where Naperville average price is higher.
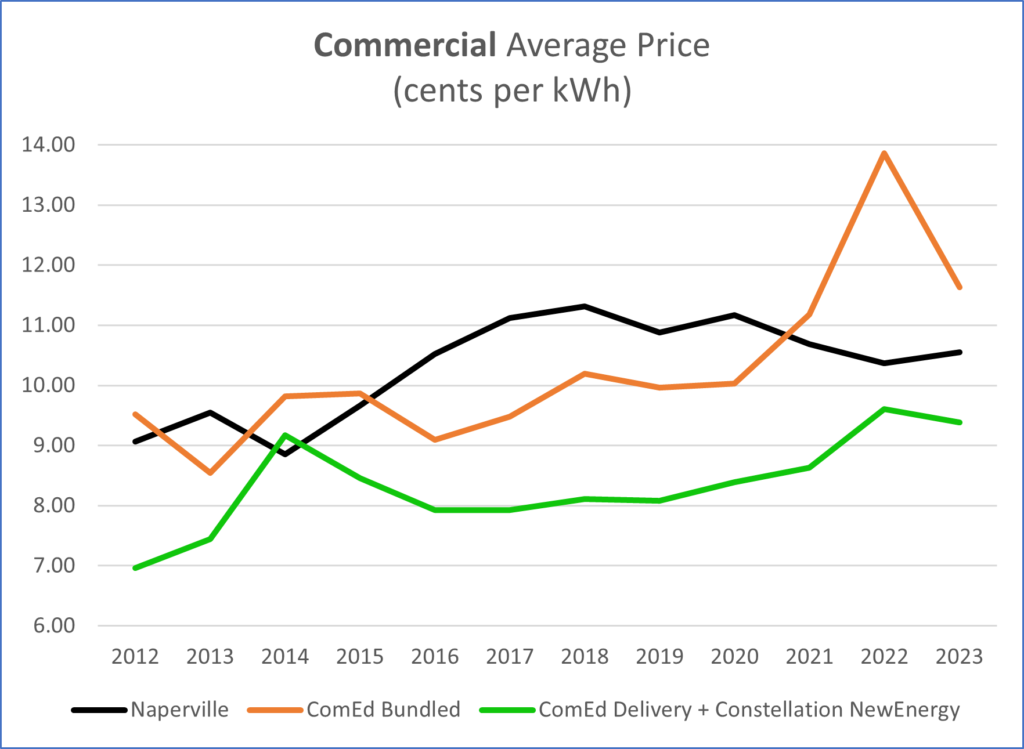
Commercial Average Price

The Commercial Average Price graph of shows that Naperville average price is lower than ComEd Bundled for 2021 through 2023, but Naperville is higher for 2016 through 2020
The Commercial Average Price graph shows that Naperville average price is higher than ComEd Delivery + Constellation NewEnergy for each year, except 2014.
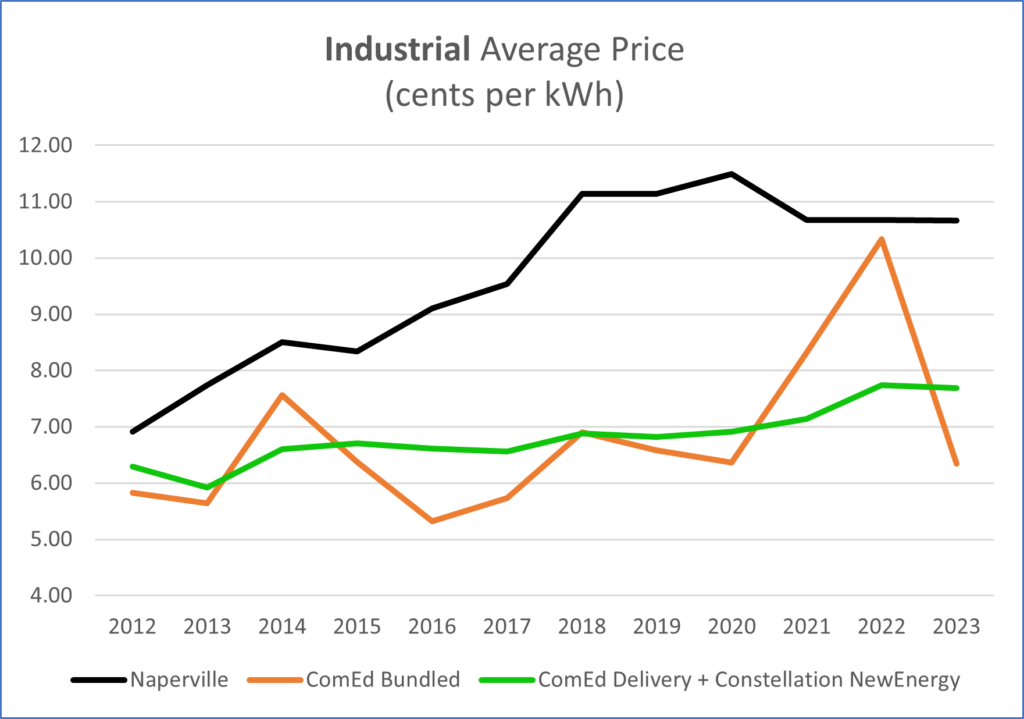
Industrial Average Price

The Industrial Average Price graph shows that Naperville average price is higher than both ComEd Bundled and ComEd Delivery + Constellation NewEnergy in every year.
Further Discussion of Results
Our comparisons support Naperville’s report that Naperville residential customers pay less for electricity than ComEd customers, but our commercial and industrial comparisons provide a different picture.
Averages alone cannot tell us a more complete story, so we suggest that Napervile consider further research to understand the billing characteristics and the types of customers that are impacted.
Commercial ratepayers include our public and private schools, our houses of worship, and our community organizations that we financially support. Commercial and industrial customers are also an important part of our local economy and tax base.
Note that EIA-861 does not offer any breakout of data to tell us about Naperville’s power supply costs vs. local Naperville distribution costs, so these comparisons do not provide any analysis on Naperville’s IMEA power supply costs.
But our ARES example using ComEd Delivery + Constellation NewEnergy does illustrate the potential cost benefit of power supply choice, especially for commercial and industrial customers. That’s where the average price differences with ComEd Bundled and Naperville are greater.
End Notes
[i]
Plugin Illinois —> Electric Choice Basics
https://plugin.illinois.gov/electric-choice-basics.html
Customers in the Ameren Illinois, ComEd, and MidAmerican service territories have the ability to choose who provides the supply portion of their electric service(1). Electric supply may be sold by either the utility or Alternative Retail Electric Suppliers (ARESs). You may be able to save money by switching your electric supplier.
(1) The Illinois Electric Service Customer Choice and Rate Relief Law of 1997 restructured the state’s electric service industry to allow a choice of electric suppliers. With electric choice, the electric supply may now be provided by different companies known as Alternative Retail Electric Suppliers (ARESs).
[ii]
Naperville Comparison Calculation Worksheets Described in Jan 11, 2025 in Email to NEST Energy Committee https://drive.google.com/drive/folders/1-R9NOxE3_0n3G5_-b187uklPeZUE2Iku
Directory with email and two attached spreadsheets
[iii]
U.S. Energy Information Administration (EIA) Form EIA-861, Annual Electric Power Industry Report
https://www.eia.gov/electricity/data/eia861
Form EIA-861, Annual Electric Power Industry Report, and Form EIA-861S (the shortform) collect data from distribution utilities and power marketers of electricity. This survey is a census of all United States electric utilities.
[iv]
U.S. Energy Information Administration (EIA) Form EIA-861, Annual Electric Power Industry Report
https://www.eia.gov/electricity/data/eia861
2023 Final Data
https://www.eia.gov/electricity/data/eia861/zip/f8612023.zip
Sales_Ult_Cust_2023.xlsx
% ARES Supplied calculated as ComEd Delivery MWhs divided by (ComEd Bundled MWhs + ComEd Delivery MWhs)
% ARES Supplied of Total ComEd
= 52,326,048 MWh / (29,964,173 MWh + 52,326,048 MWh)
= 63.6%